Simulate Example: Chan2 (Classic Monte Carlo)
This page documents a simulate run in plain Monte Carlo mode (without importance sampling).
Note: Table values are rounded to 4 significant figures for readability. Very small/large values use scientific notation. Refer to the Excel/JSON result files for full precision.
Run Context
Problem module:
problems/problems2/Chan2Problem.py
Recorded result set:
results/2026-04-02/20-31-44/Chan2-a1af3.xlsxresults/2026-04-02/20-31-44/Chan2-a1af3.jsonresults/2026-04-02/20-31-44/Chan2-a1af3.pyresults/2026-04-02/20-31-44/Chan2-a1af3.pickleresults/2026-04-02/20-31-44/Chan2-a1af3.pdfresults/2026-04-02/20-31-44/profile-a1af3.yaml
Profile and run mode from saved profile:
- Profile used:
default run_type: simulateinclude_mc: truemc_with_is: false
For results-folder and filename conventions, see CLI Result Files.
Equivalent command shape:
reliafy simulate <profile>
The simulate command without -i runs plain (crude) Monte Carlo only.
Profile Customization
This example uses the default profile, but simulate behavior is configurable. See Profile Options Reference.
- Monte Carlo controls:
reliability_options.mc_n,mc_max_cv,mc_seed,mc_remove_oob. - Report toggles:
reporting_options.save_plots_to_pdf,save_plots_to_pickle,save_excel_summary.
Problem File Used
Source: Chan, C. L. and Low, B. K., "Practical second-order reliability analysis applied to foundation engineering," International Journal for Numerical and Analytical Methods in Geomechanics, 2012, vol. 36, no. 11, p. 1387–1409, Problem 2, p. 1397. →
Chan2Problem.py defines:
- Stochastic variables:
cp,fp,g,Ph,Pv— all Normal - Correlation: full 5 × 5 matrix defined using the
corkey (see note below) - Deterministic variables:
B = 5.0,L = 25.0,D = 1.8,h = 2.5 LSFreturnsGradient: False,LSFreturnsHessian: False,LSFreturnsLandR: True- Limit state returns load (P_v / B') and resistance (bearing-capacity formula)
Using cor vs cor_list
Chan2Problem.py specifies the correlation matrix as a full n × n list of lists under the cor key.
This is an alternative to cor_list, which accepts a flat list of [var1, var2, value] pairs.
If neither cor nor cor_list is supplied, Reliafy assumes zero correlation for all variables.
Either key may be used; the full matrix form is convenient when many off-diagonal correlations are non-zero.
"StochasticVariables": {
    "name": ["cp", "fp", "g", "Ph", "Pv"],
    "type": ["normal", "normal", "normal", "normal", "normal"],
    "cor": [
        [1.0, -0.5,  0.0,  0.0, 0.0],
        [-0.5, 1.0,  0.5,  0.0, 0.0],
        [0.0,  0.5,  1.0,  0.0, 0.0],
        [0.0,  0.0,  0.0,  1.0, 0.5],
        [0.0,  0.0,  0.0,  0.5, 1.0],
    ],
    "mean": [15.0, 25.0, 20.0, 400.0, 800.0],
    "std":  [4.5,  5.0,  2.0,  40.0,  80.0],
},
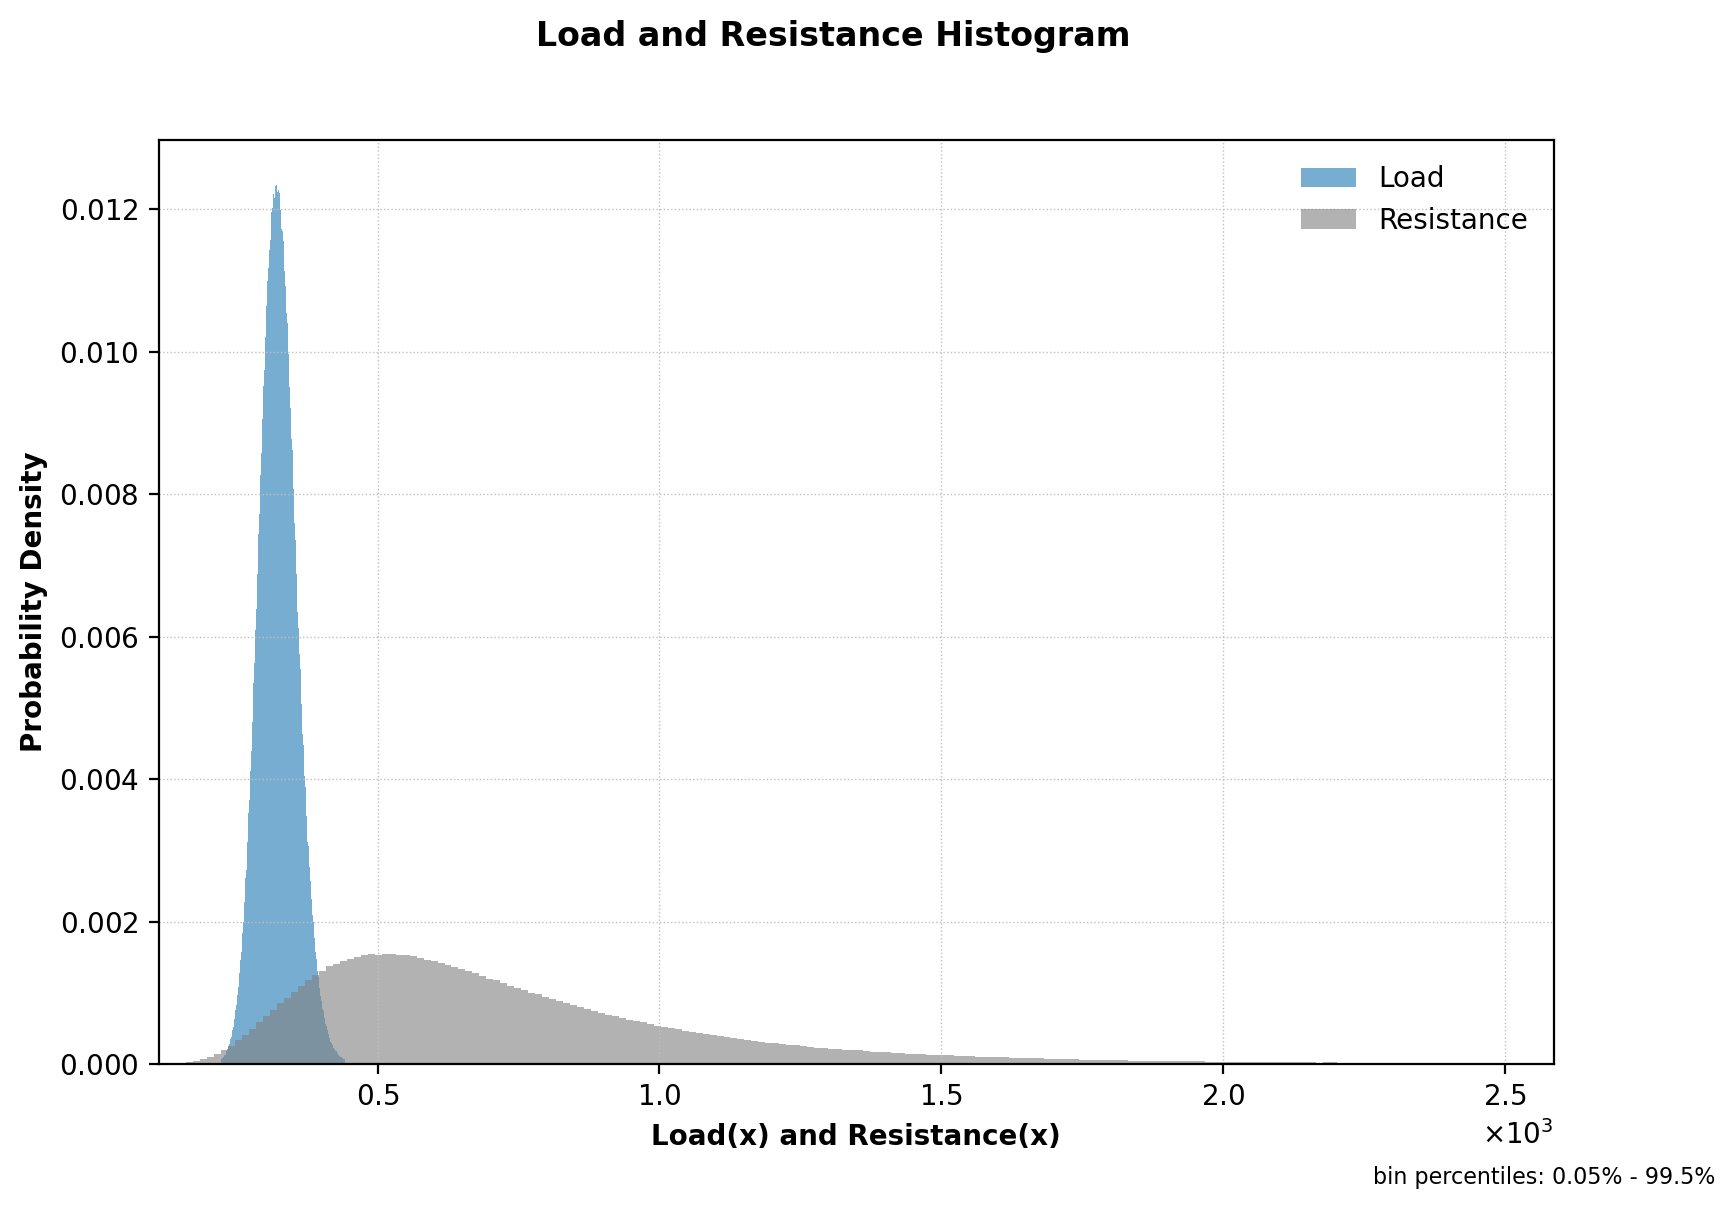
Because LSFreturnsLandR: True, the CLI generates a Load and Resistance Histogram in addition to the per-variable and LSF histograms.
Extracted Results Worksheet Tables
The tables below are transcribed from the Results worksheet in Chan2-a1af3.xlsx.
Header Information
| Field | Value |
|---|---|
| Problem | Chan2 |
| Request ID | c89975be9921407491d307b104ea1af3 |
| Run time | 00 min 03.51 sec |
Deterministic Variables
| var_name | value |
|---|---|
| B | 5 |
| L | 25 |
| D | 1.8 |
| h | 2.5 |
Stochastic Variables Definition
| var_name | var_type | mean | std | param1 | param2 |
|---|---|---|---|---|---|
| cp | Normal | 15 | 4.5 | 15 | 4.5 |
| fp | Normal | 25 | 5 | 25 | 5 |
| g | Normal | 20 | 2 | 20 | 2 |
| Ph | Normal | 400 | 40 | 400 | 40 |
| Pv | Normal | 800 | 80 | 800 | 80 |
Monte Carlo Results
| beta | pf | cv | max_cv | size | %_removed | cycles | auto_size | mc_with_is |
|---|---|---|---|---|---|---|---|---|
| 1.5408 | 0.06169 | 0.002252 | 0.05 | 3,000,000 | 0.0007 | 3 | True | False |
Monte Carlo Variable Statistics and Correlations
The sampled statistics confirm the input distributions and correlation structure.
| var_name | mean | std | %_oob | cor(cp) | cor(fp) | cor(g) | cor(Ph) | cor(Pv) |
|---|---|---|---|---|---|---|---|---|
| cp | 15.0023 | 4.5010 | 0 | 1.0000 | −0.4994 | 0.0003 | −0.0007 | −0.0004 |
| fp | 24.9984 | 5.0013 | 0 | −0.4994 | 1.0000 | 0.4997 | 0.0000 | 0.0002 |
| g | 20.0017 | 1.9998 | 0 | 0.0003 | 0.4997 | 1.0000 | −0.0005 | 0.0001 |
| Ph | 399.944 | 39.978 | 0 | −0.0007 | 0.0000 | −0.0005 | 1.0000 | 0.4998 |
| Pv | 799.836 | 79.992 | 0 | −0.0004 | 0.0002 | 0.0001 | 0.4998 | 1.0000 |
Notes Reported by Reliafy
- Validation: Stochastic variables definition and limit state function validation required 1 function call.
- Monte Carlo: Completed 3 cycles with
1.00e+06samples per cycle. - Monte Carlo: Detected 21 NaN values in the limit state function out of
3.00e+06samples. Review the list of code warnings and update the limit state function to address their source. - Monte Carlo: If a large fraction of values are invalid, consider adjusting the statistical distributions of the variables, truncating them to finite lower (
lb) and upper (ub) bounds, and defining constraints on the variables to avoid invalid results.
Interpretation Snapshot
beta = 1.541,pf = 6.17%— a relatively low reliability index for a bearing-capacity problem with correlated soil parameters.- The coefficient of variation (
cv = 0.00225) is well belowmax_cv = 0.05, indicating high MC precision with 3 million samples. - The sampled correlation matrix closely matches the targets:
cor(cp, fp) ≈ −0.500,cor(fp, g) ≈ 0.500,cor(Ph, Pv) ≈ 0.501. - A small number of NaN results (21 out of 3,000,000) were detected. These typically arise from geometric degeneration in the bearing-capacity formula (e.g.,
B' ≤ 0due to large eccentricity). They do not invalidate the result at this sample size. - Reliafy also reported that if invalid values become more frequent, finite
lbandubbounds or explicit variable constraints are the first things to revisit.
Generated Figures
The PDF result file for this run is saved as results/2026-04-02/20-31-44/Chan2-a1af3.pdf.
The PNGs below were regenerated from the saved Matplotlib pickle in the same result set so they match the current histogram bin capping used by the API.
Figure 1: MC Histogram — cp
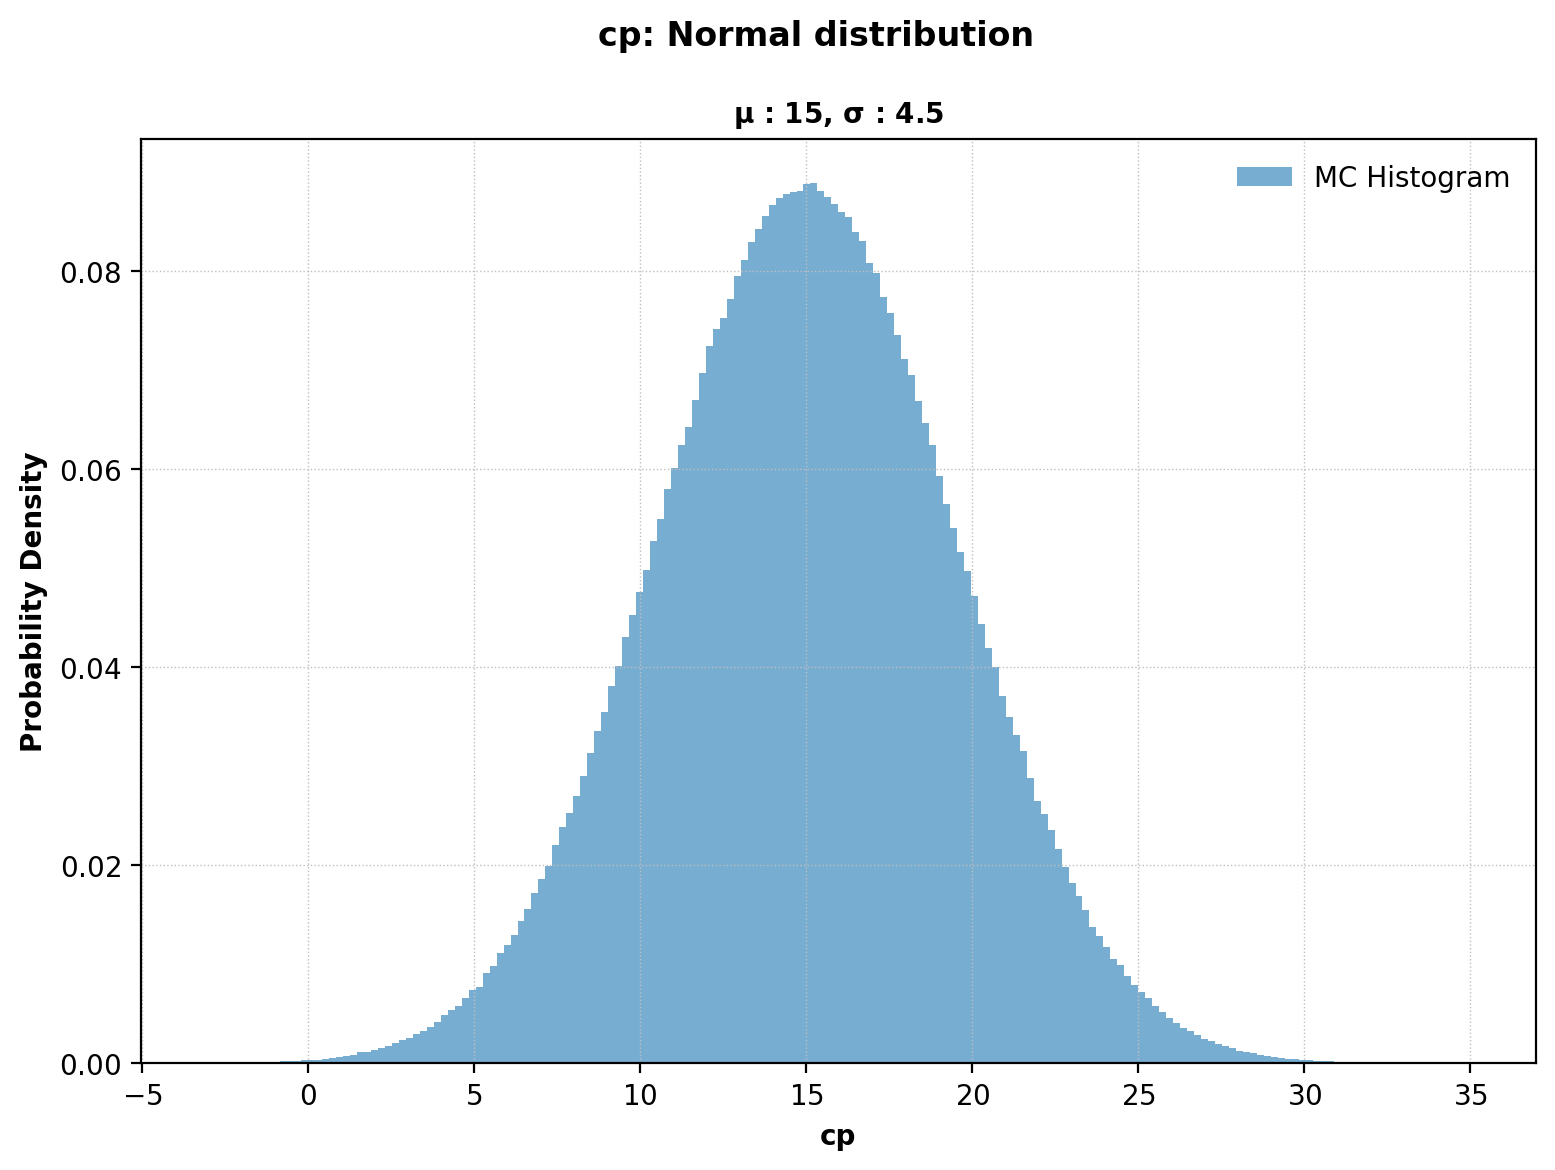
Figure 2: MC Histogram — fp
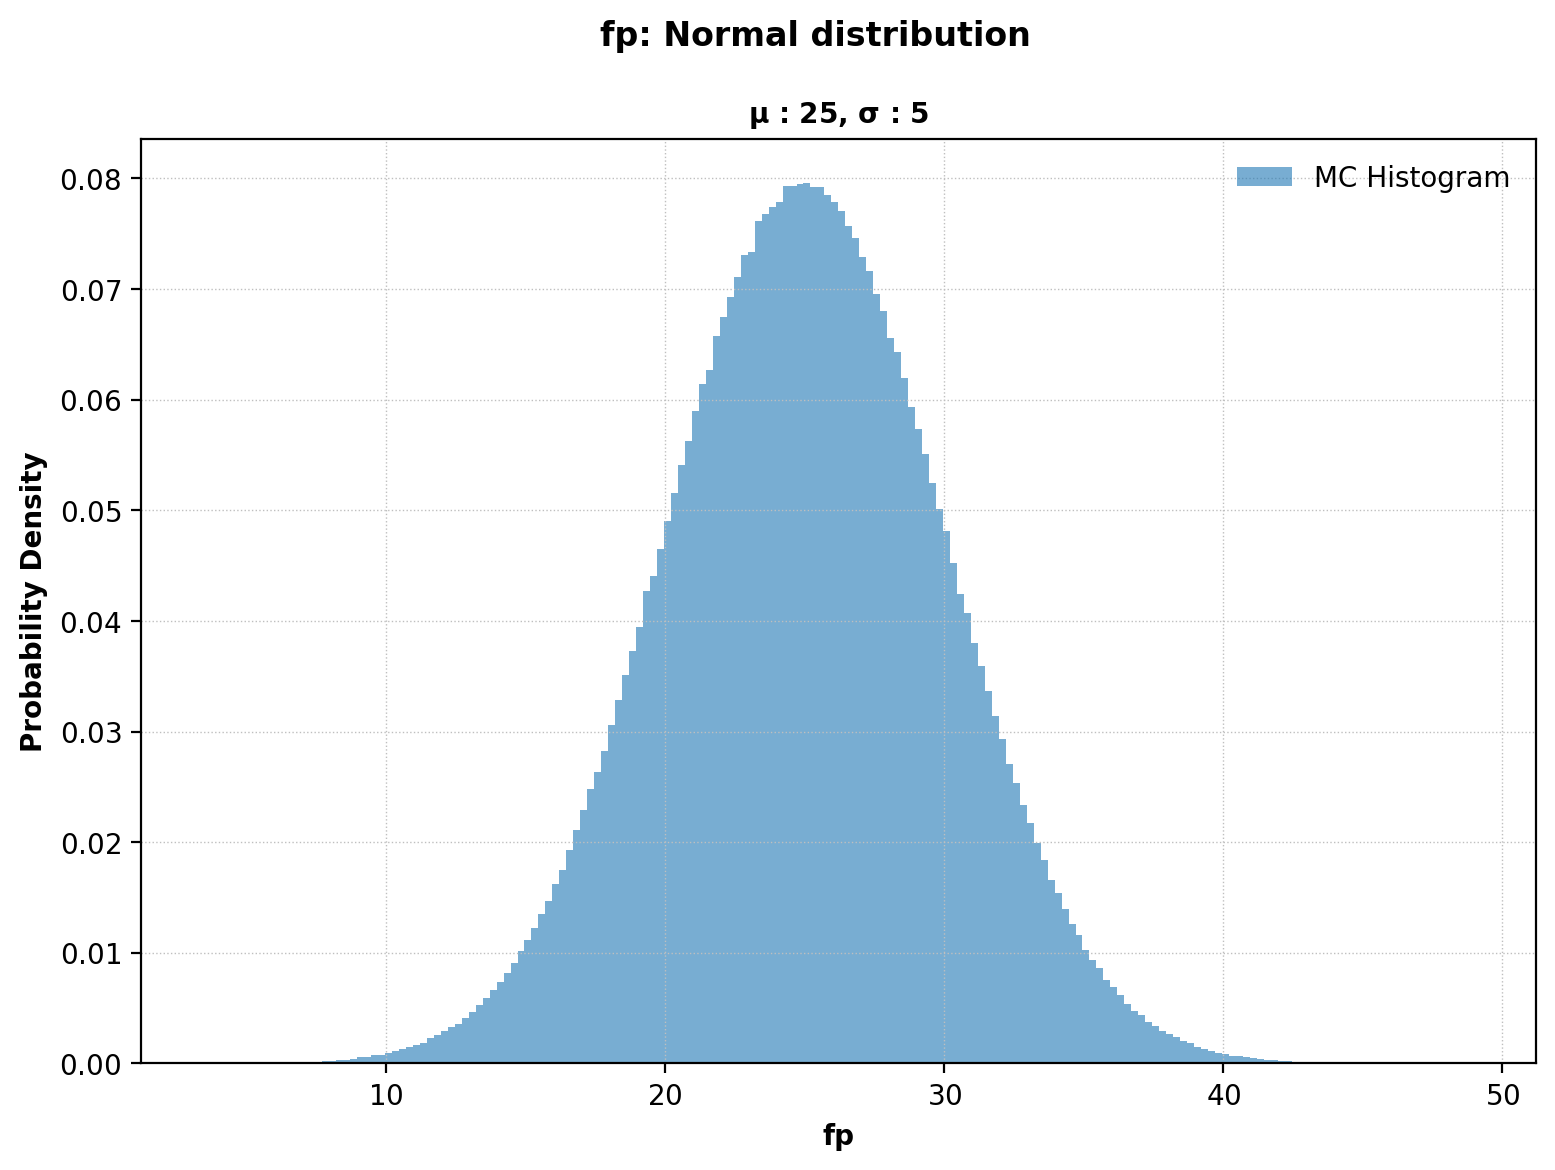
Figure 3: MC Histogram — g
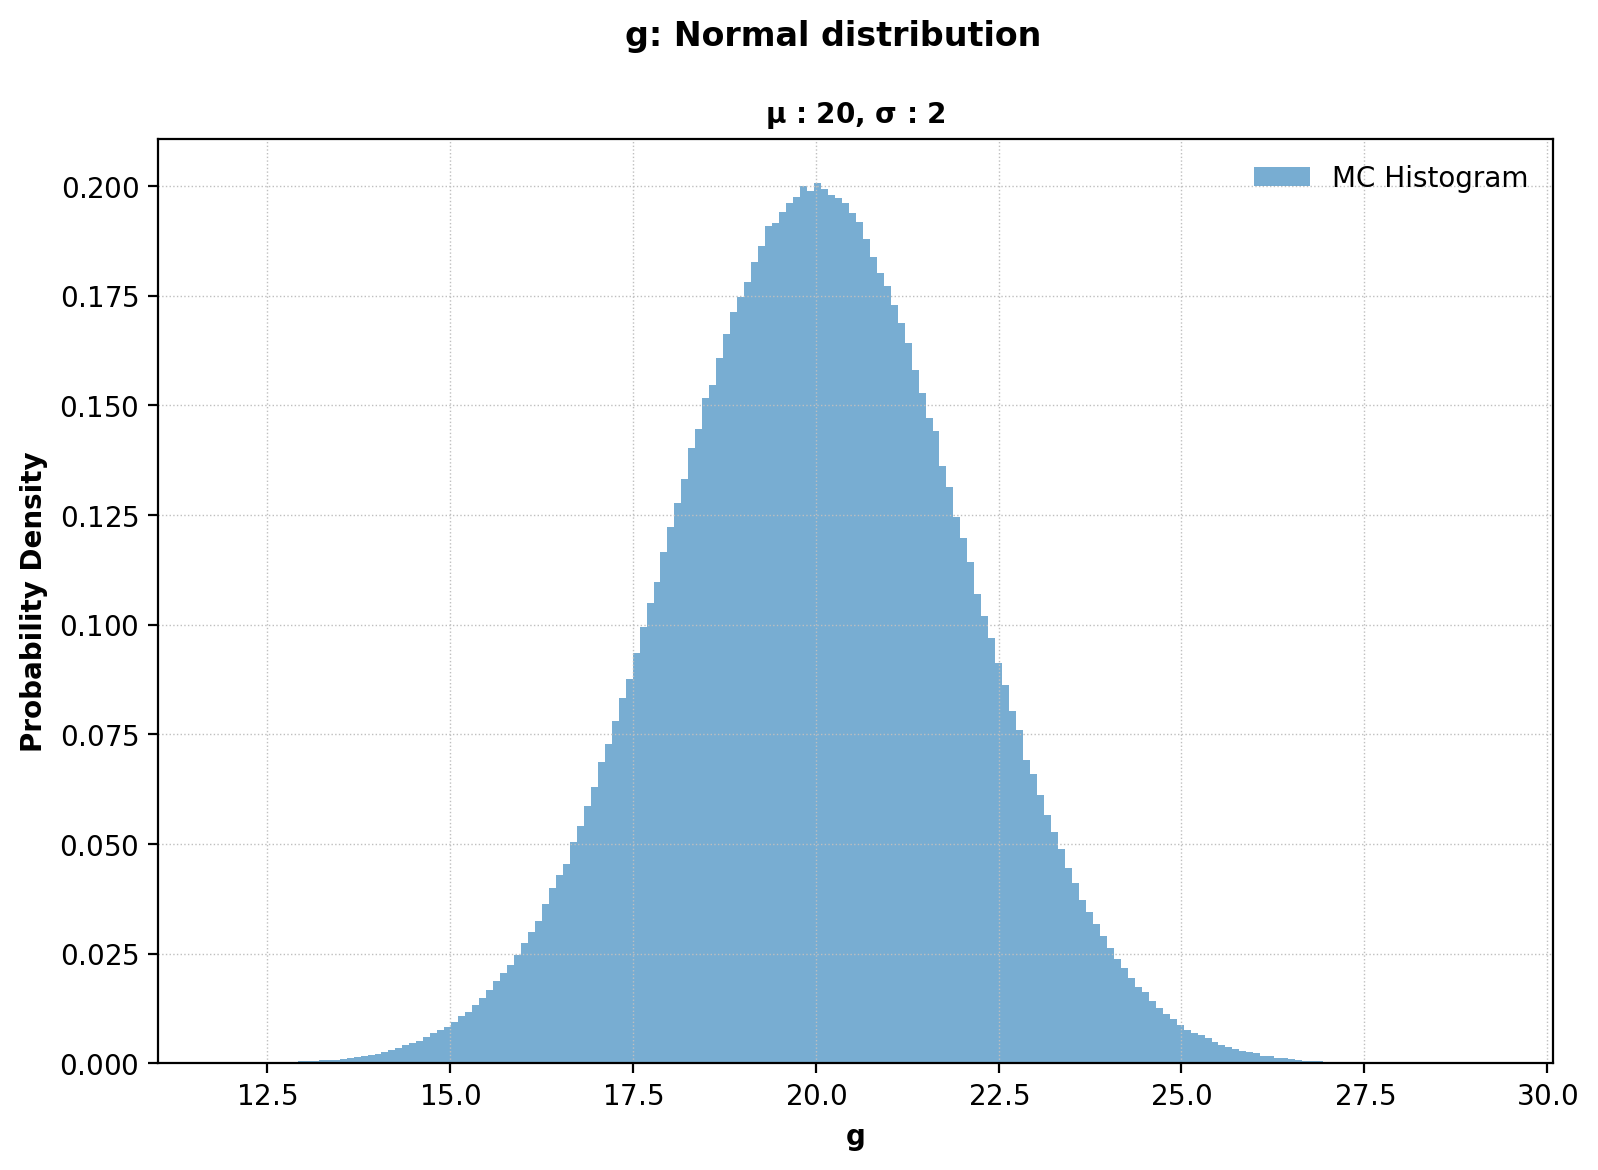
Figure 4: MC Histogram — Ph
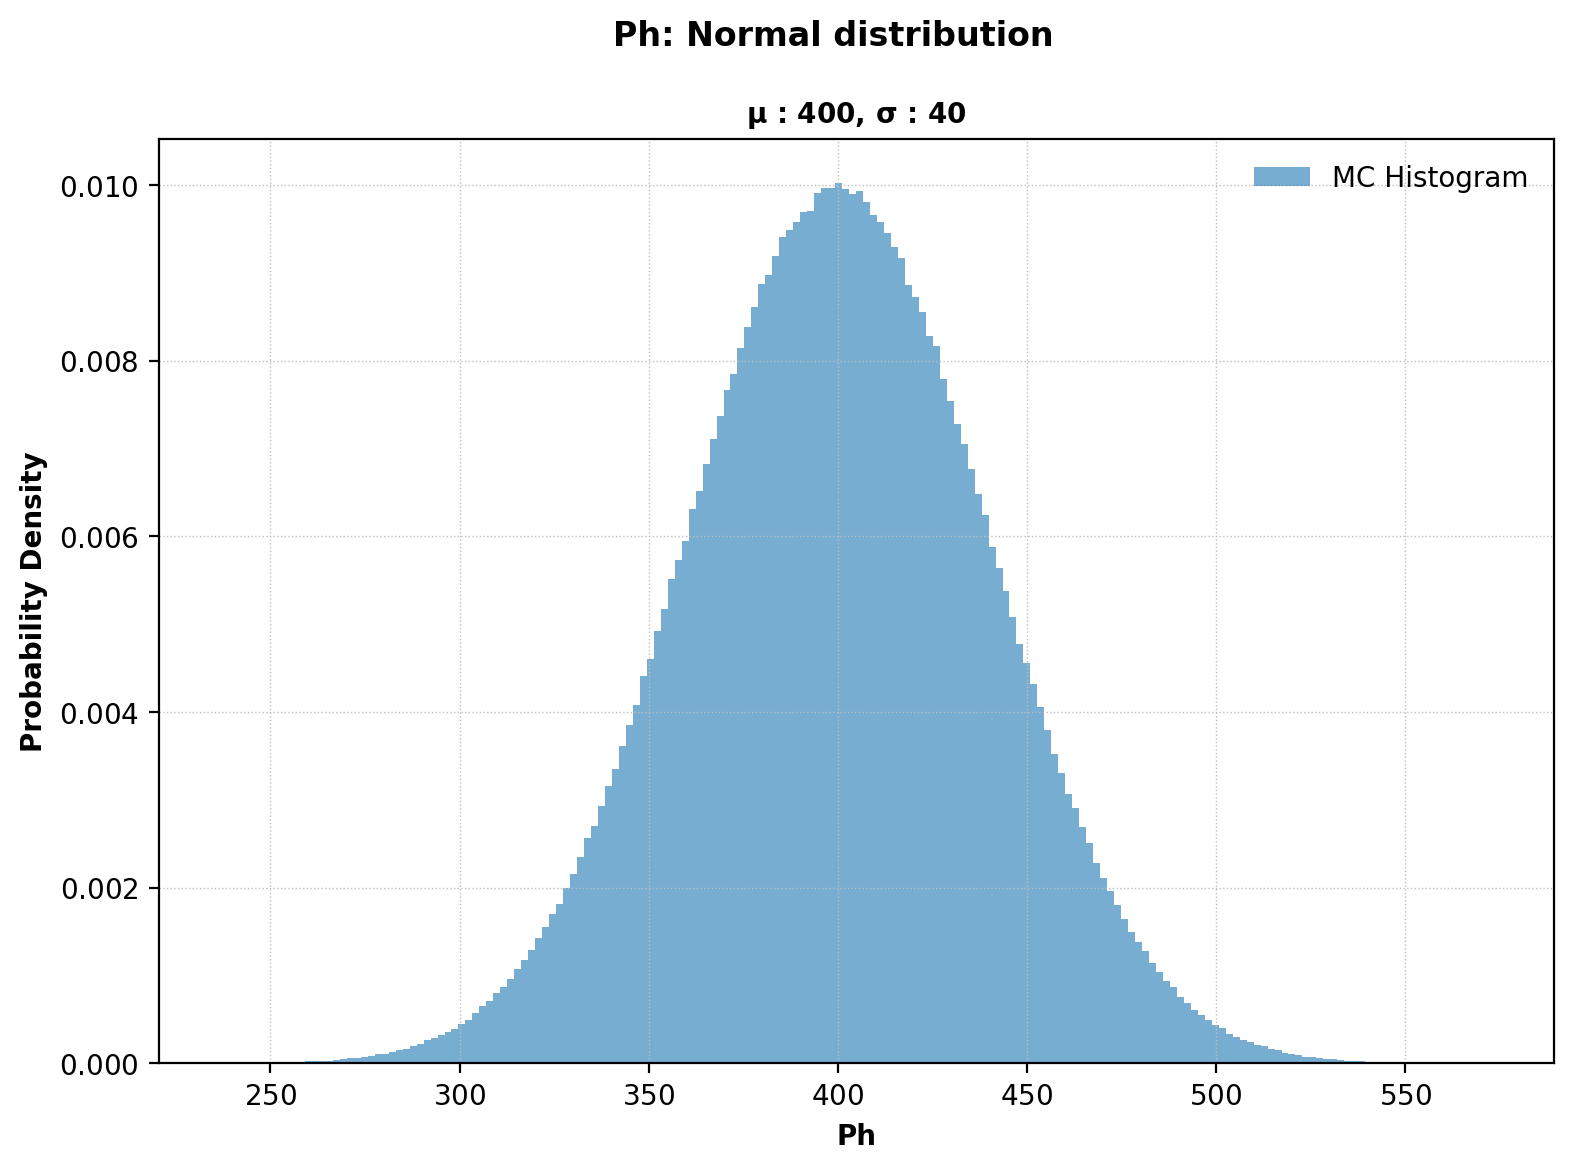
Figure 5: MC Histogram — Pv
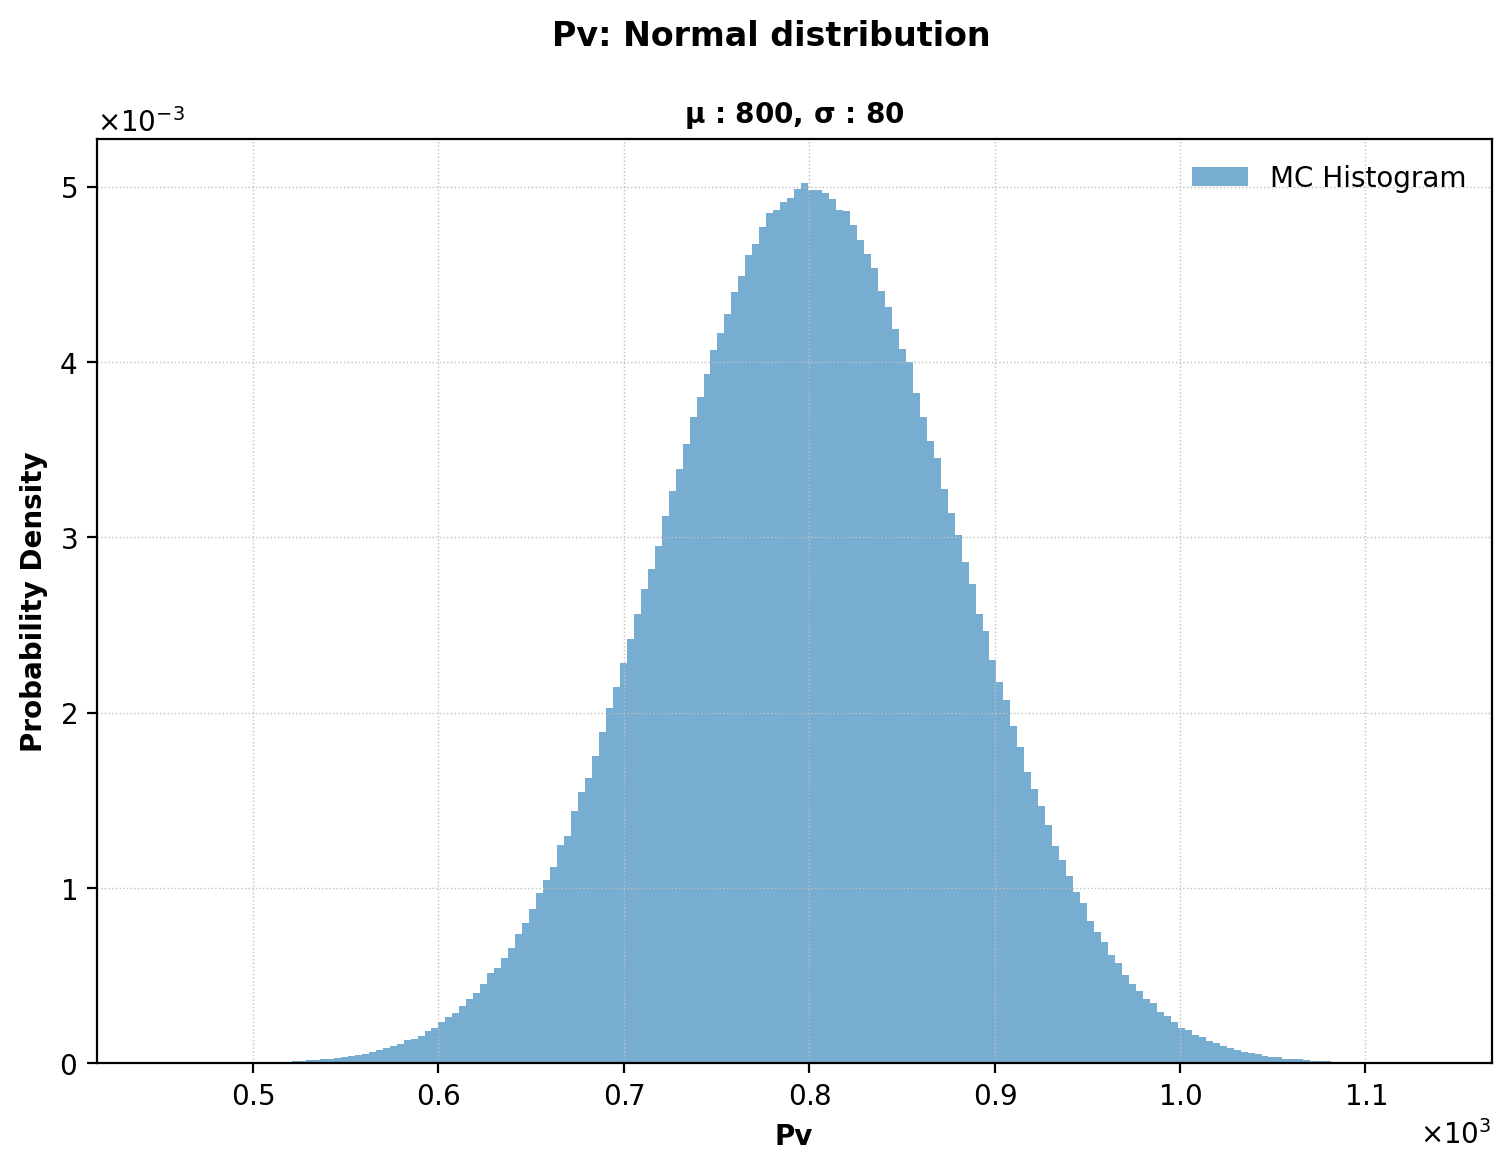
Figure 6: Histogram of Limit State Function Values
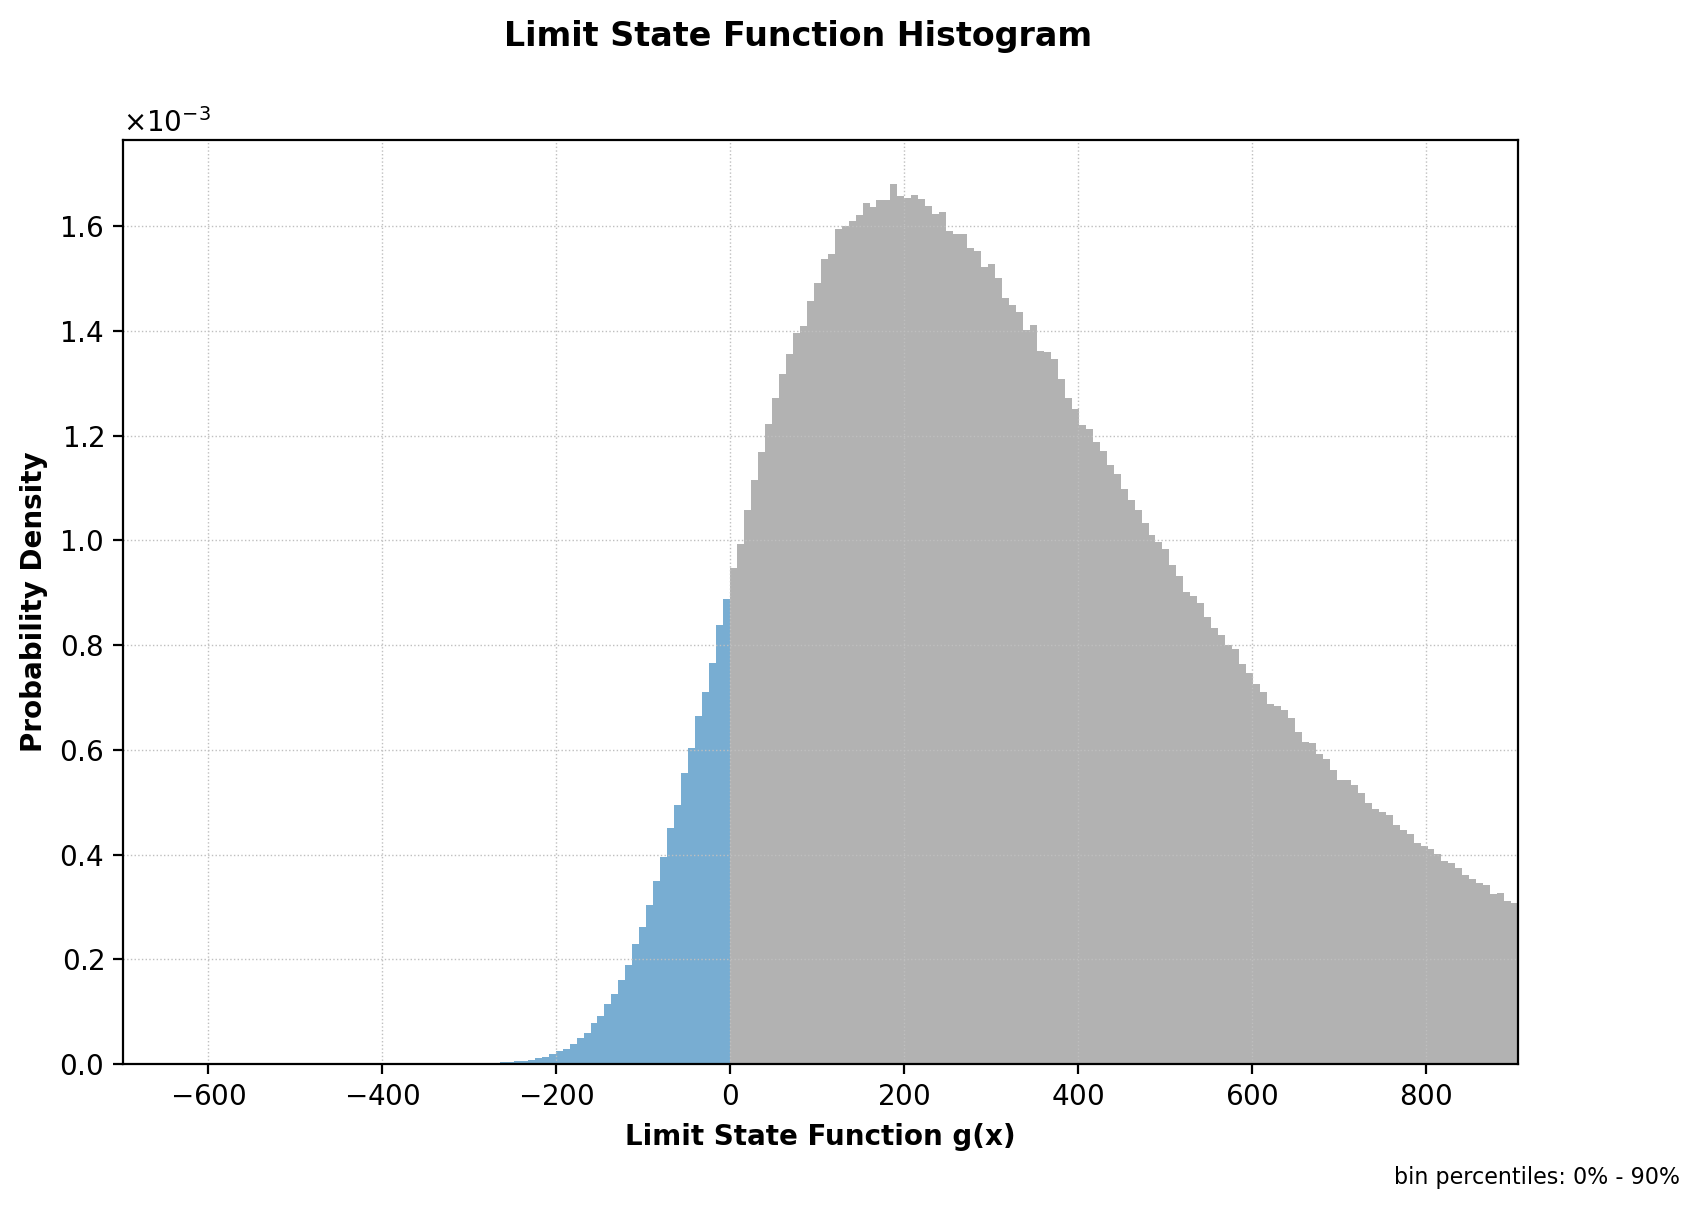
Figure 7: Load and Resistance Histogram
Generated because LSFreturnsLandR: True in the problem file.